
Take these messages home
Biology provides a common language for precision medicine. Mapping clinically generated RNA in biological space made measurements from different laboratories more comparable while preserving meaningful biological differences across Sid’s treatment course.
Cancer biology has persistence and flux. Across 25 months, Sid retained a core set of tumor biological features while stress and repair, plasticity, the microenvironment, and immune state changed through treatment. Disease-specific and pan-cancer biological comparisons provided context for understanding what persisted, what changed, and what was unusual.
Biology can inform therapeutic hypotheses. Integrating Sid’s longitudinal biology with treatment history, genomics, and independent measurements changed how potential therapeutic mechanisms were interpreted. Some hypotheses gained support, some required further evidence, and a few were deprioritized.
Precision medicine requires a view of biology
Precision medicine is practiced one patient at a time. But a patient’s biology is constantly changing, adapting, and evolving. The data we use to follow those changes rarely come from a controlled longitudinal experiment. Tumors change under treatment. Biopsies differ in composition. Molecular measurements are generated by different laboratories, often months or years apart. Each sample captures only one moment in a disease that continues to evolve.
The practical challenge is to determine which differences reflect technical variation, which reflect biological change, and what that biology means for the individual patient. Doing that requires more than measuring a small set of genes at a series of independent time points. The biology must remain comparable across clinical settings, interpretable in the context of the patient’s disease and a pan-cancer reference, and specific enough to inform therapeutic hypotheses.
Biomedical AI provides a way to address that problem by placing an individual patient’s biology in a unified biological context to inform clinically actionable hypotheses.
Sid Sijbrandij’s public osteosarcoma record provides an unusually direct test of those ideas. Four usable tumor RNA-seq libraries span 25 months, 3 clinical laboratories, multiple cycles of recurrence, and several treatment phases. The series gives us the opportunity to ask whether a large molecular biomedical AI model can follow the biology of one patient through treatment, separate biological change from technical variation, and use that biological history to generate clinically actionable hypotheses.
Sid’s clinical course
T0 data was derived from the December 2022 resection, prior to his first round of therapy, and was sequenced independently by two commercial providers. T1 was collected on 11 June 2024 after chemotherapy-based treatment, a neoantigen vaccination, trabectedin and pazopanib, and during dexamethasone. T2 was collected on 28 January 2025, about 6 months into a period that included PD-1 blockade, ipilimumab, intratumoral oncolytic virus, autologous NK cells, an IL-15 superagonist, and proton therapy.
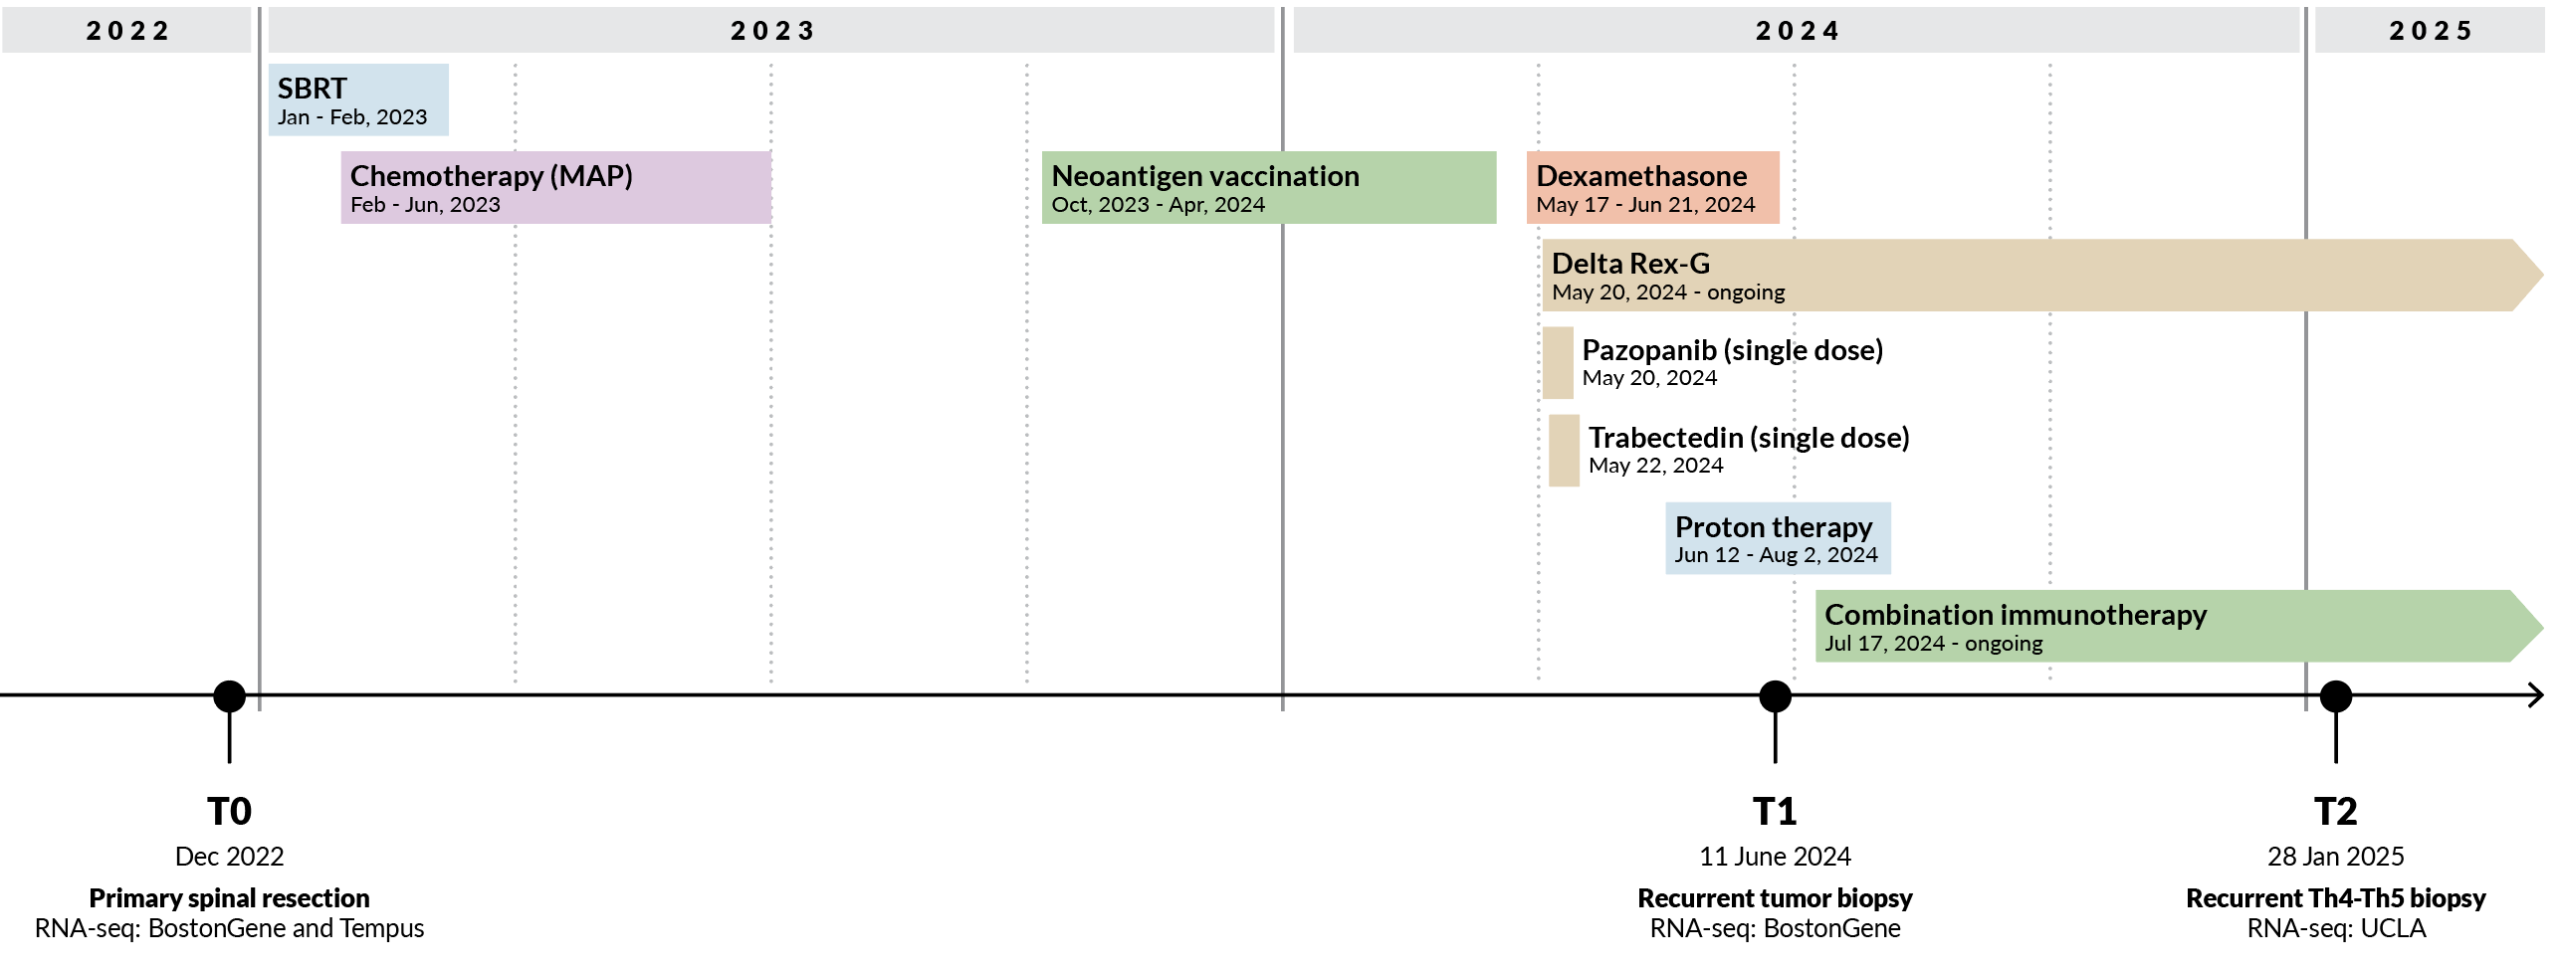
Figure 1. Sid’s longitudinal clinical course and tumor sampling. Three tumor time points span 25 months of treatment, recurrences, and changing clinical context. RNA-seq generated from different specimens and laboratories across this period illustrates a central challenge for longitudinal precision medicine: distinguishing meaningful biological change from the technical and clinical heterogeneity inherent to real-world patient data.
The Genialis Supermodel approach to data heterogeneity and clinical interpretation
The Genialis Supermodel is an exemplar of biomedical AI designed to work with heterogeneous clinical RNA-seq and produce an interpretable biological representation. We applied the Supermodel to Sid’s tumor across 25 months of treatment and asked whether that representation could work across heterogeneous clinical data, reduce the effects of technical variation, support transparent biological interpretation, and ultimately inform therapeutic hypotheses.
Work within the heterogeneity of standard clinical data
RNA-seq is a clinically tractable molecular measurement that is deployed at scale across clinical laboratories and hospital settings. Yet, precision medicine rarely produces a controlled molecular dataset. Sid’s RNA-seq was generated from different specimens, by different laboratories, at different sequencing depths, and from tumors with markedly different tumor content. A model intended for longitudinal precision medicine must work across that heterogeneity without requiring samples to be regenerated under a common experimental protocol. We therefore analyzed the RNA-seq generated during Sid’s care through a common Genialis processing and QC pipeline before representing each sample in biological space with the Supermodel.
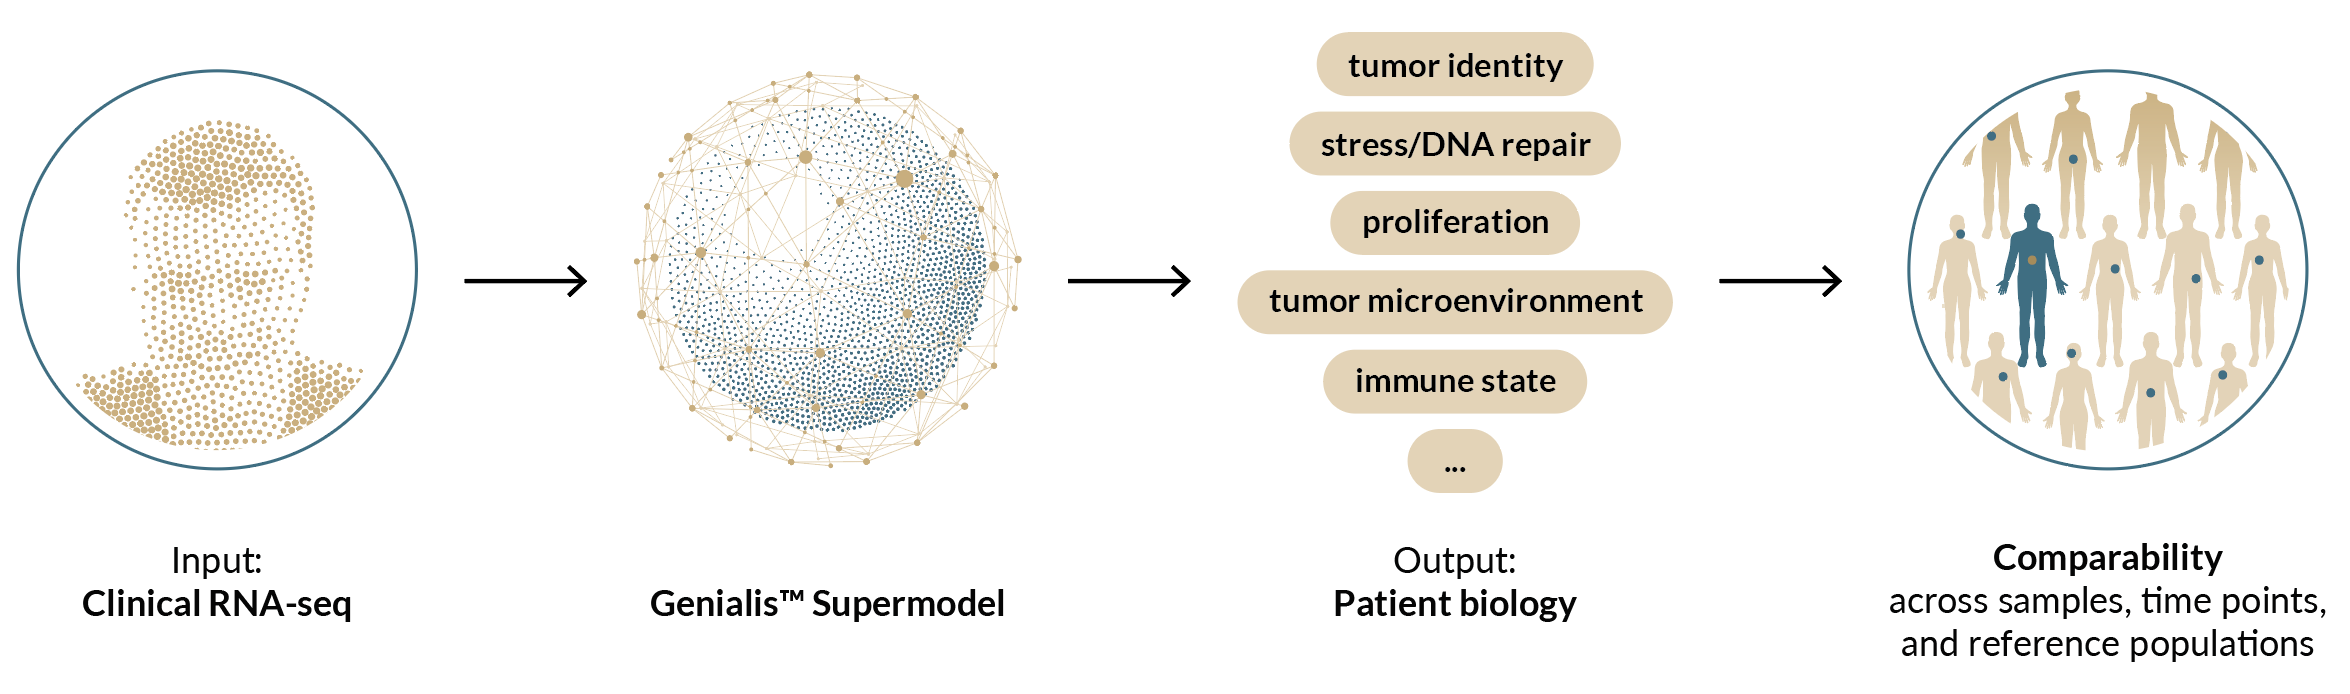
Figure 2. Biology-first analysis of longitudinal clinical RNA-seq. RNA-seq generated during Sid’s clinical care is processed through a common workflow and represented by the Genialis Supermodel in biological space.
Harmonize biology across technical variation
To assess the impact of technical variation on Supermodel-derived biology, we used Sid’s T0 tumor as an internal technical control. The same tumor was sequenced independently by 2 laboratories, allowing us to directly measure how much the inferred biology changed when the underlying specimen remained constant.
Technical variation is a persistent challenge when comparing RNA-seq data generated by different sequencing providers, laboratories, and chemistries. One way to reduce these effects is to generate samples under the same technical conditions, and we see that in Sid’s gene-expression data: T0 and T1 measured by the same laboratory were considerably more concordant (Spearman ρ = 0.86) than the 2 measurements of the same T0 tumor generated by different laboratories (ρ = 0.65). In Supermodel biomodule space, however, this difference largely disappeared. The 2 T0 measurements generated by different laboratories had a correlation of ρ = 0.83, essentially the same as T0 and T1 measured by the same laboratory (ρ = 0.82).
Thus, the Supermodel-derived biology remained consistent across sequencing providers even when the underlying gene-expression measurements did not. This allows biological comparisons across laboratories and datasets without applying post hoc batch correction to the biological representation, which can remove biological signal along with technical variation.
We placed all of Sid’s samples into a common biological space standardized to a cohort of primary osteosarcomas. This disease-specific reference provides a common scale for each biological program: a difference of 1 standard deviation corresponds to 1 standard deviation of biological variation across the osteosarcoma reference cohort. In this space, the 2 independent T0 measurements remained closely aligned. Across the biomodule-derived biological programs analyzed, the median difference between laboratories was 0.46 standard deviations of the osteosarcoma reference, indicating that the biological representation was relatively stable despite cross-laboratory technical variation.
Longitudinal differences were substantially larger for specific biological programs. Between T1 and T2, coordinated changes in interferon, inflammatory, cytotoxic, and immune-regulatory biology reached several standard deviations relative to the osteosarcoma reference. Because the T0 replicate provides an empirical estimate of cross-laboratory technical variation for the same tumor, biological changes that substantially exceed that benchmark are less likely to be explained by laboratory variation alone. These longitudinal changes are shown in Figure 3.
This provides the practical basis for longitudinal comparison: technical variation can be measured directly, and biological change can then be interpreted relative to that empirical benchmark.
Make biological interpretations transparent and auditable
Biomedical AI models used in precision medicine need to produce biological interpretations that can be examined rather than merely accepted as model outputs. We therefore interrogated Sid’s biology at several levels: how individual biological systems changed across his treatment course, how those measurements compared with other osteosarcomas, how they compared against a pan-cancer reference of approximately 22,000 tumors, and whether independent measurements supported the resulting interpretation.
Longitudinal analysis revealed elements of biological continuity alongside substantial change. Osteolineage, mesenchymal, proliferative, stress/repair, microenvironmental, and immune biology followed distinct patterns across the 25-month series. From T0 to T1, hypoxia and stress-response activity decreased while replication and selected DNA-repair-associated transcription increased, alongside changes in the sampled stromal and myeloid microenvironment. These observations occurred across an interval containing DNA-damaging therapy and are consistent with that treatment context, although the data cannot attribute individual changes to a specific treatment. From T1 to T2, the dominant change was immunologic, with large increases in interferon, cytotoxic T/NK, and immune-regulatory biology.
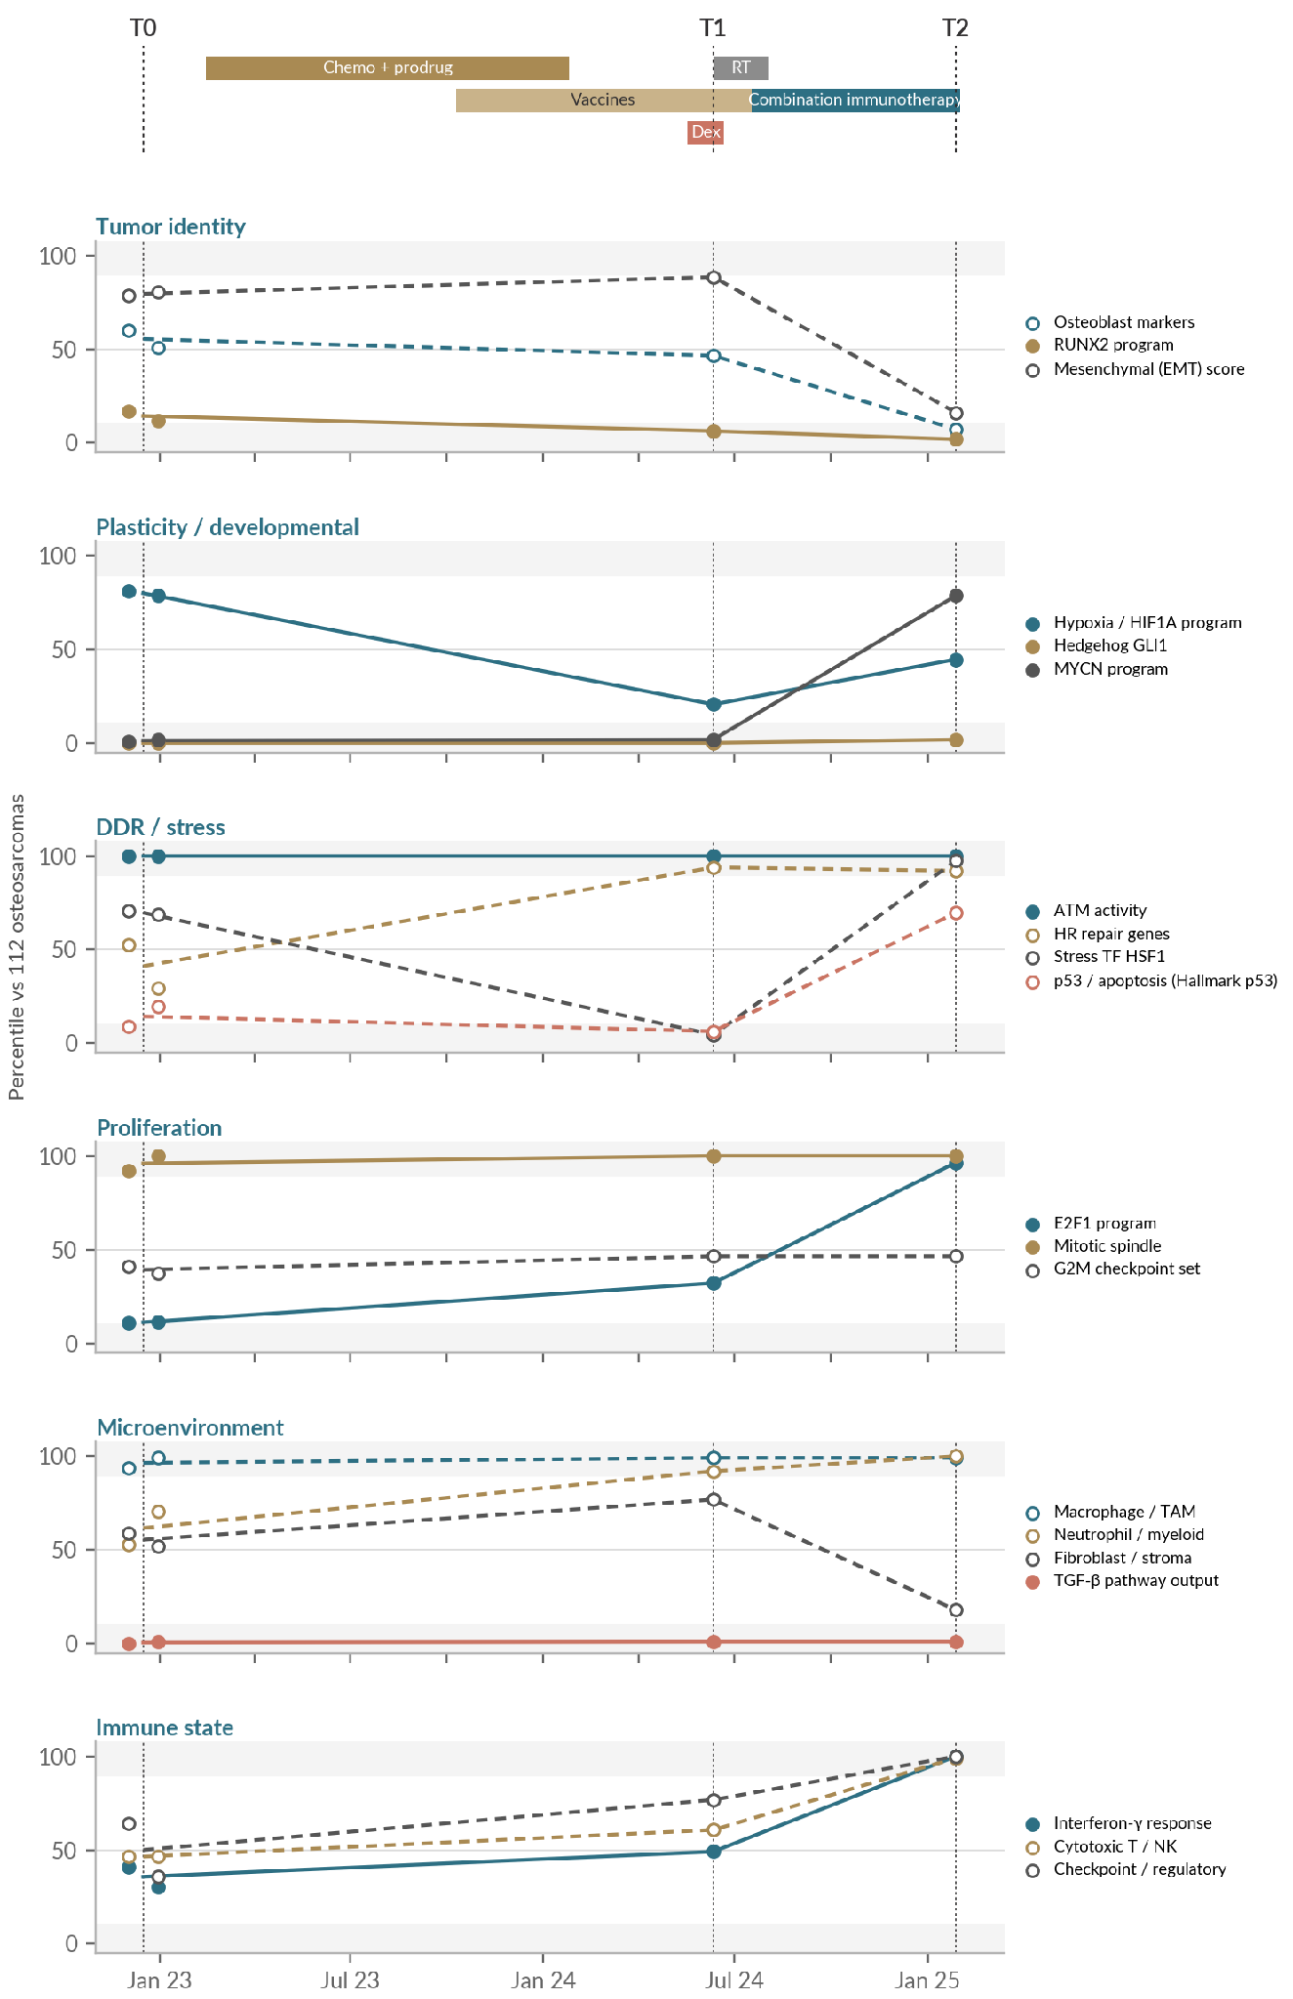
Figure 3. Sid’s tumor biology across 25 months of treatment. Longitudinal biological measurements are shown relative to 112 primary osteosarcomas and aligned with major treatment exposures. Biological systems show distinct patterns across the series, including persistent tumor-associated programs, changes in stress and DNA-repair biology during the earlier interval, and a pronounced inflammatory and immune state at T2.
Biological features were derived from RNA-seq data processed using the Genialis Supermodel. T1 was collected during dexamethasone exposure, which may have influenced immune measurements at that time point. The T2 specimen also had substantially lower estimated tumor purity, so decreases in tumor-intrinsic programs were interpreted cautiously. The strongest T2 conclusion is the coordinated inflammatory and immune state observed in the sampled tissue.
Reference populations provide biological context for these longitudinal changes. The same biological measurement can have very different meaning within osteosarcoma and against a pan-cancer reference. Osteoblast-lineage biology, for example, was extreme relative to cancer overall but much less unusual among osteosarcomas. At T2, osteoblast markers remained near the top of the pan-cancer distribution while falling toward the bottom of the osteosarcoma distribution. Conversely, T2 interferon and cytotoxic immune biology became exceptional within osteosarcoma while corresponding to immune states observed elsewhere in the pan-cancer reference. The reference frame therefore helps distinguish tumor identity, disease-specific biology, and biological states that transcend the tissue diagnosis.
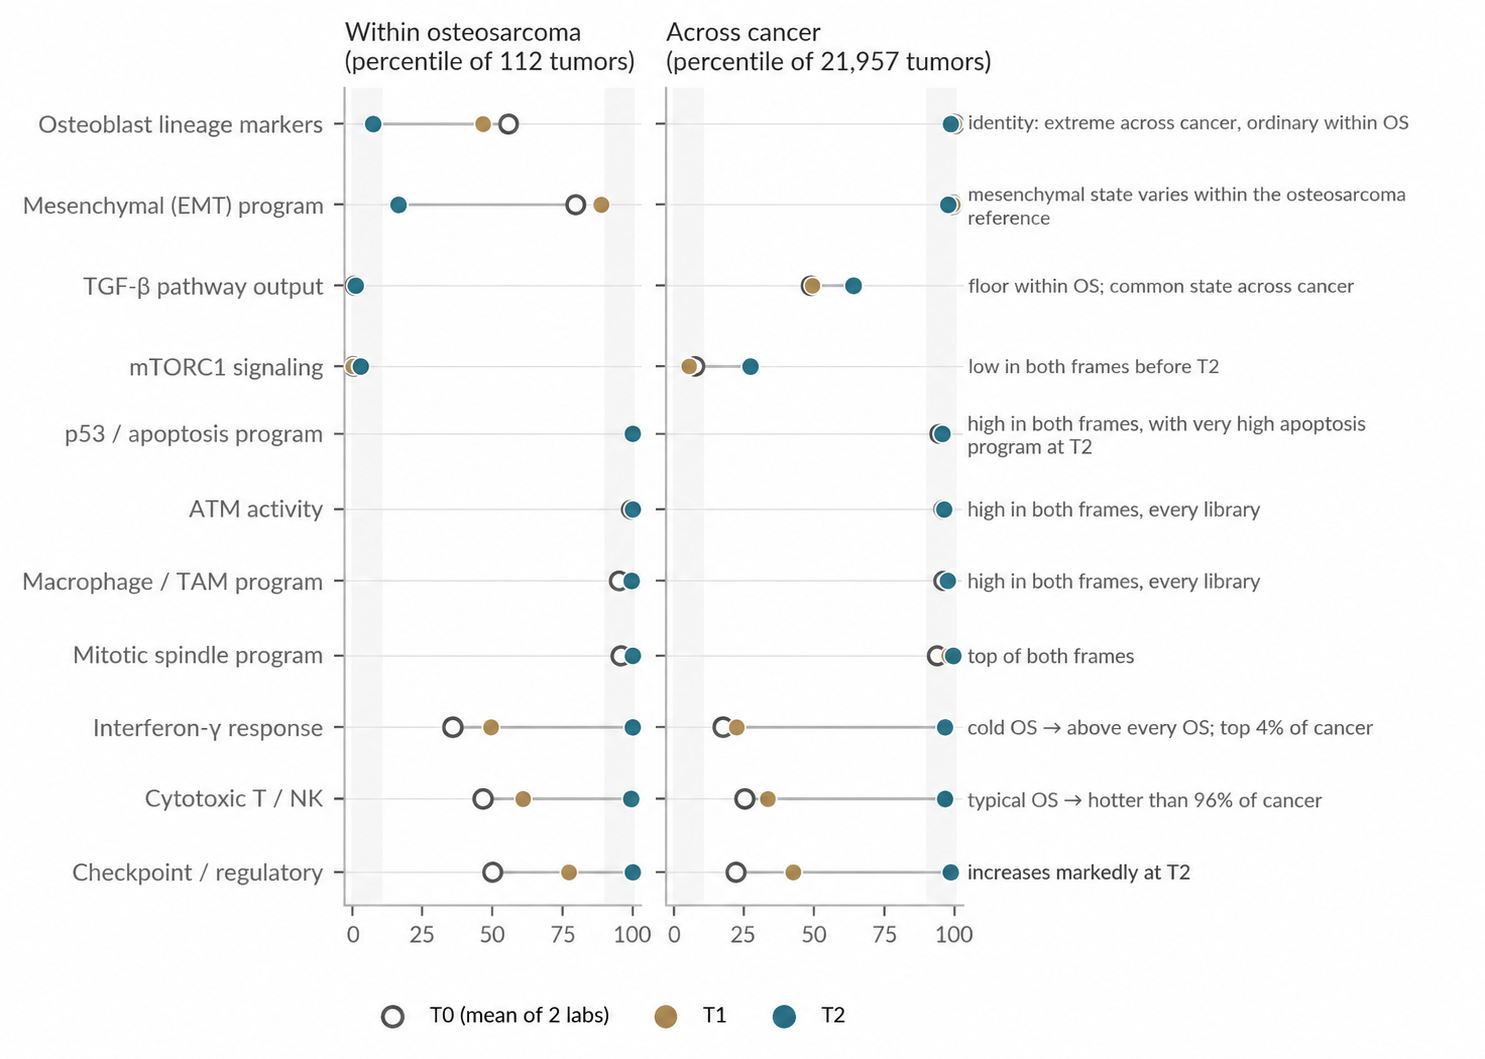
Figure 4. Biological context depends on the reference population. Selected biological features from T0, T1, and T2 are shown as percentiles within 112 primary osteosarcomas (OS) and 21,957 tumors in the pan-cancer reference. Comparing the same measurements across both reference populations distinguishes biology characteristic of osteosarcoma from patient-specific states and biological states shared across tumor types. Biological features were derived from RNA-seq data processed using the Genialis Supermodel. Treatment between T1 and T2 included nab-sirolimus, which should be considered when interpreting mTORC1-related biology at T2.
Independent measurements provide another test of the interpretation. For example, the strong inflammatory and T-cell state at T2 coincided with 65% of circulating CD8 T cells carrying bound anti-PD-1 drug shortly before T2, repeatedly undetectable Signatera ctDNA, and a subsequent large increase in T-cell representation by single-cell profiling. These measurements interrogate different aspects of Sid’s disease, but their convergence supports the immune-rich state identified from the longitudinal RNA analysis.
Turn biology into clinically actionable hypotheses
Longitudinal biological profiling changes how potential therapies are interpreted. Once we know which programs persist, which emerge during treatment, and which are active in the current tumor state, therapeutic hypotheses can be evaluated against the biology of the individual patient.
For Sid, we integrated this longitudinal biology with treatment history, genomic alterations, ctDNA/MRD, and known drug-target relationships to build a therapeutic hypothesis map. The analysis identified new therapeutic axes and combination strategies, provided biological support for re-challenge or genomically anchored approaches, identified hypotheses that require additional evidence, and deprioritized targets whose current biological context argues against inhibition.
The T2 immune state illustrates this approach. Combination immunotherapy was accompanied by strong interferon and cytotoxic immune activity together with increased immune-regulatory biology. This raises clinically actionable hypotheses around mechanisms that could constrain the ongoing immune response or contribute to subsequent resistance (Ribas, 2015; Zaretsky et al., 2016). Persistent biology provides another source of evidence: sustained myeloid and proliferative programs can strengthen the rationale for therapeutic mechanisms supported by Sid’s genomic and treatment history (Cook et al., 2013; Zhou et al., 2020). Conversely, high target expression does not necessarily support inhibition. JAK2, for example, was highly expressed throughout the series. At T2, strong JAK/STAT, STAT1/IRF1, and interferon-response activity lowers the rationale for inhibiting JAK2 in the current biological state, where doing so could blunt the ongoing immune response (Shin et al., 2017).
The therapeutic hypothesis map captures these distinctions. It connects each potential intervention to the biological evidence supporting it, its current interpretation, and the evidence needed to act on it. As Sid’s disease changes, the map will evolve with it. A future sample can be compared directly with the biological states already measured to determine which mechanisms persist, which disappear, and which emerge.
In this way, longitudinal biology provides a framework for continually refining clinically actionable hypotheses as the patient’s cancer and treatment context change.
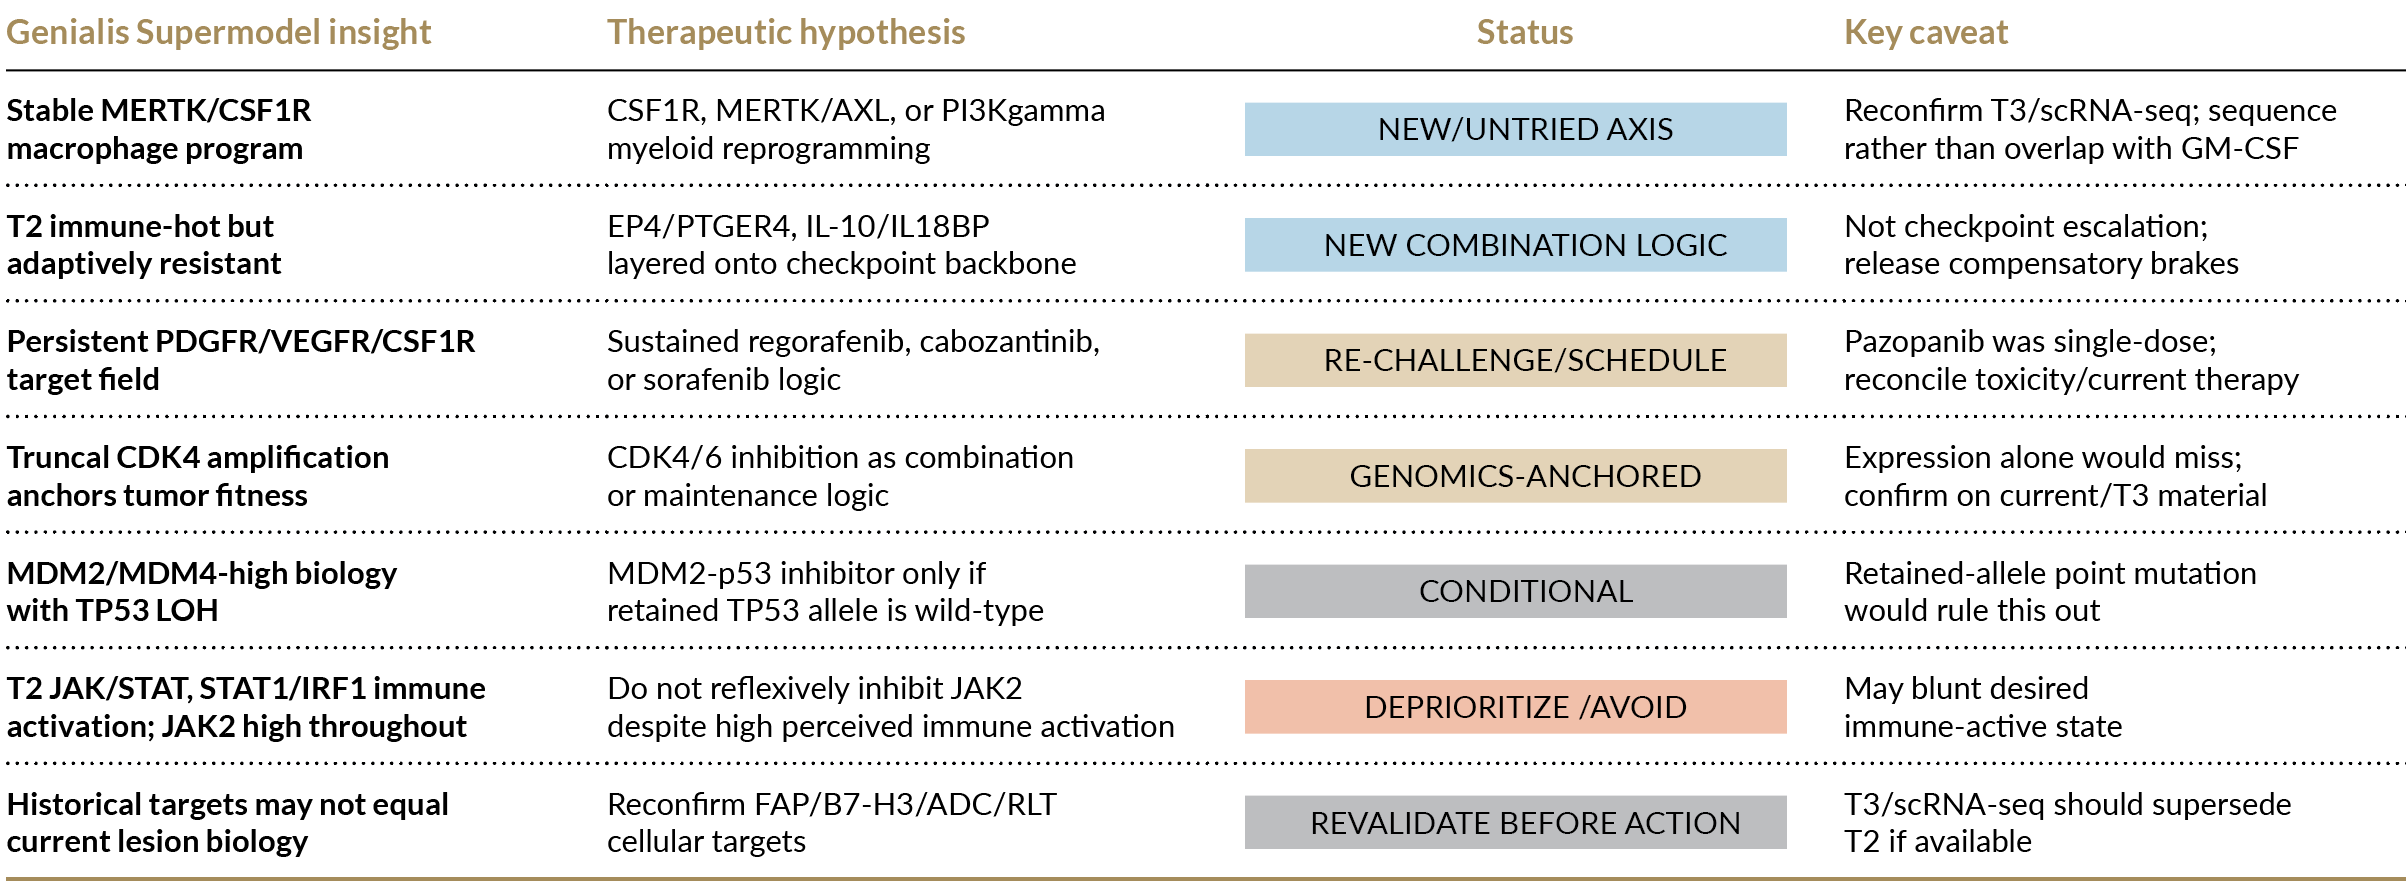
Figure 5. Therapeutic hypothesis map based on Sid’s biology through T2. Longitudinal tumor biology through T2 was considered alongside treatment history, genomic alterations, ctDNA/MRD, and drug-target relationships to identify therapeutic hypotheses for future evaluation, their current interpretation, and key evidence required for further evaluation. Research Use Only. Hypothesis-generating analysis; none of the findings described here was used to guide Sid’s care.
What this means for precision medicine
Sid’s case shows what longitudinal precision medicine can look like in practice. Four RNA-seq libraries collected over 25 months, across 3 laboratories and multiple treatment phases, were converted into a common biological representation that remained comparable across technical settings while preserving meaningful biological change.
That biological representation made it possible to follow Sid’s tumor over time, distinguish persistent biology from treatment-associated change, interpret each state relative to other osteosarcomas and against the pan-cancer reference, and, ultimately, connect those observations to clinically actionable hypotheses.
The central point is simple: precision medicine benefits from a biological view of the patient that is updated as the disease changes. Clinically tractable measurements become more useful when they can be compared longitudinally, interpreted in the right reference frame, and used to refine therapeutic hypotheses for that individual patient.
Selected references
- Cook RS, et al. MerTK inhibition in tumor leukocytes decreases tumor growth and metastasis. J Clin Invest. 2013;123:3231-3242.
- Zhou Y, et al. Blockade of the phagocytic receptor MerTK on tumor-associated macrophages enhances STING activation by tumor-derived cGAMP. Immunity. 2020;52:357-373.
- Zaretsky JM, et al. Mutations associated with acquired resistance to PD-1 blockade in melanoma. N Engl J Med. 2016;375:819-829.
- Shin DS, et al. Primary resistance to PD-1 blockade mediated by JAK1/2 mutations. Cancer Discov. 2017;7:188-201.
- Ribas A. Adaptive immune resistance: how cancer protects from immune attack. Cancer Discov. 2015;5:915-919.
- osteosarc.com public data portal: clinical events, MRD, cytometry, genomics, and associated analyses.