
Take these messages home
Cancer cells, fibroblasts, and T cells together generate an inflammatory program that none produces independently. Neither PANC-1 alone nor PANC-1 with fibroblasts expressed detectable CXCL9 or IDO1. Adding CD8 T cells to the tri-culture triggered a coordinated inflammatory response, with CXCL9 expression exceeding the predicted contribution of the individual cultures.
That response moves the model’s biology toward the patients it is meant to represent. PANC-1 cultures and 1,001 patient tumors were projected into a common biological subspace. PANC-1 alone exhibits biology completely distinct from 99.7% of patients. The tri-culture moves closest to the biology represented in patients, a shift of 3.4 standard deviations of patient variation.
The inflammatory state it creates is a phenocopy of the one patients have. The CXCR3 chemokines, the shift of fibroblasts out of a collagen-producing state, and the dependencies between them all replicate across 3 independent patient cohorts. The culture phenocopies a patient-derived inflamed tumor state characterized by the same chemokine axis and additional myeloid cellular components.
A patient reference for preclinical model selection in PDAC
Pancreatic cancer models, like most preclinical models, are historically selected on practical grounds and then interpreted as though they represent some population of patients. While the bedrock of preclinical studies, preclinical model systems rarely are examined to better understand which biological patient context they represent.
Pancreatic ductal adenocarcinoma epitomizes this challenge. In patients, these tumors carry extensive desmoplastic stroma, immune infiltration spans a wide range between patients, and immune checkpoint blockade benefits only a small minority of cases1. A model that reproduces one region of that biological variation will not generalize across the broader context.
Inventia Life Science and Genialis addressed this challenge together. Inventia’s RASTRUM platform uses precise, reproducible 3D bioprinting to encapsulate cancer cells alongside defined stromal and immune cell populations within tailored synthetic extracellular matrices.2 Genialis interprets RNA-seq profiles into measures of tumor biology that apply equally to a culture and to a resected tumor using a foundation model of cancer called the Supermodel3. Together these permit a specific question to be asked of any culture condition: which patients does it resemble?
Experimental design and patient reference cohorts
Answering that question requires a culture system in which cellular composition is set deliberately, and a patient reference measured on the same terms. PANC-1 pancreatic cancer cells were bioprinted in a defined 3D matrix representative of the PDAC microenvironment on the RASTRUM platform under 4 conditions: monoculture, co-culture with pancreatic cancer-associated fibroblasts, co-culture with activated CD8 T cells, and tri-culture containing all 3 cell types. Arms containing T cells were profiled in triplicate; monoculture and the fibroblast co-culture were profiled in duplicate. All libraries were total RNA.
Culture and patient profiles were interpreted with the Genialis Supermodel, a large molecular AI model of cancer that resolves an RNA-seq profile into discrete measures of tumor biology, termed biomodules. Bioprinted cultures and patient tumors are projected into the same biological space.
The patient reference comprised 1,001 pancreatic tumors from 3 independently assembled datasets: a clinically annotated collection (n = 644), TCGA PAAD (n = 178) and CPTAC PDAC (n = 179)4, 5. A further 41 pancreatic cancer cell lines grown as conventional 2D cultures were included from CCLE6.
Inventia data were used for evaluation only. No component of the Supermodel was trained or retrained on them.
Cellular complexity shifts PANC-1 toward the patient distribution
The 4 conditions differ only in which cells are present, so their position relative to patient tumors measures what each added cell type contributes to the biology of the model. To assess the biology, the total RNA sequencing from each culture condition was processed using the Genialis Supermodel to generate scored and scaled biological outputs termed biomodules. Biologies captured by the Supermodel include both intrinsic processes, such as cellular signaling and DNA damage programs, and extrinsic processes, such as immune hot or cold status and cellular composition.
A principal component analysis was fitted to the 1,001 patient profiles across all 150 biomodules. Culture profiles were then projected into that space without refitting. Figure 1 presents the same projection twice, colored by the immune signature, which predicts immune contexture as hot or cold, and by fibroblast content, which quantifies stromal or fibroblast content.
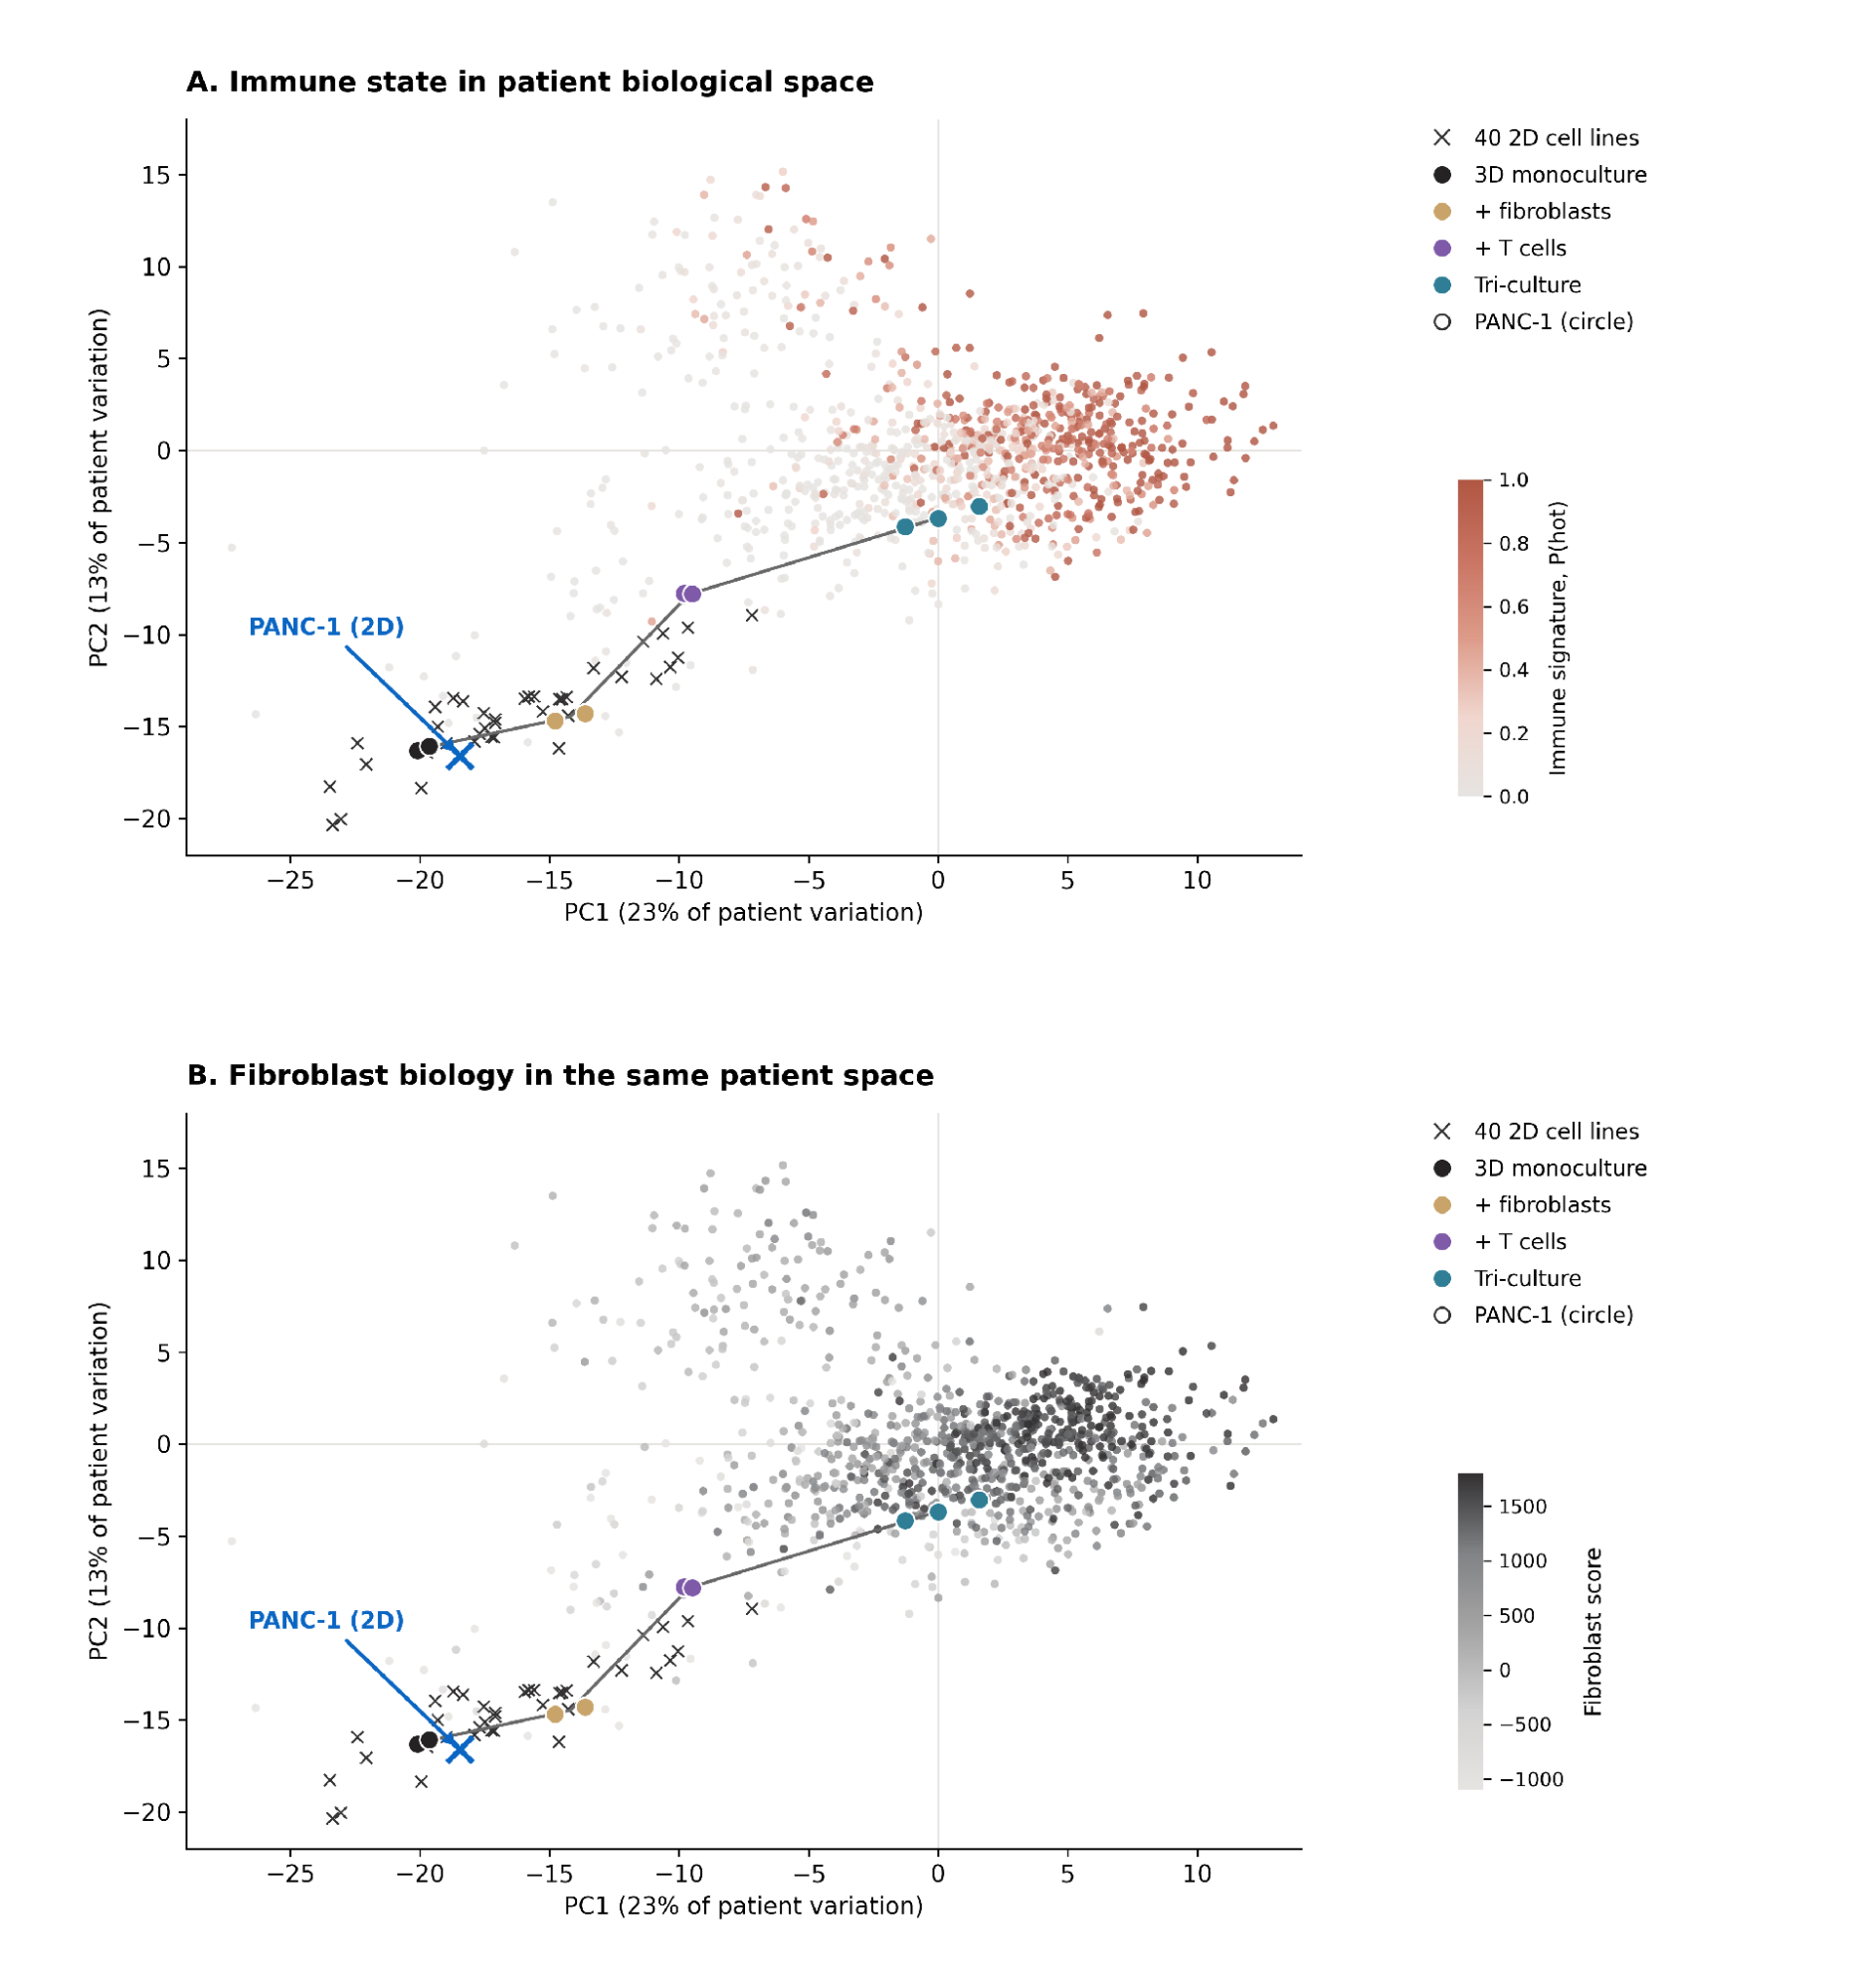
Figure 1. PANC-1 cultures projected into patient biological space. A and B show the same principal component analysis, fitted to 1,001 patient tumors across 150 Supermodel biomodules, with the bioprinted cultures and 41 CCLE 2D cell lines projected in without refitting. Small points are individual patients, colored by the immune signature in A and by fibroblast content in B. Crosses are 2D cell lines, with PANC-1 labeled. Circles are PANC-1 bioprinted conditions, one per replicate, joined in order from 3D monoculture to tri-culture.
The 2D cell lines occupied the margin of the patient distribution. 40 of 41 fell below the 10th percentile of patients on the immune signature, and the highest scored 0.003 against a patient median of 0.192. PANC-1 in 3D monoculture occupied the same region.
Position on the immune signature shifted progressively with cellular complexity. Monoculture fell below 99.7% of patients, the fibroblast co-culture below 98.2%, the T-cell co-culture below 93.1%, and the tri-culture reached the 55.8th percentile. Total displacement was 3.4 standard deviations of patient variation.
Most of this displacement was attributable to the T cells. The fibroblast co-culture shifted position only marginally relative to monoculture, a result taken up below.
To test whether the separation between models and patients reflects a dataset effect, we compared the 2 independent measurements of PANC-1 available here: as a 2D line in CCLE and as a 3D monoculture generated at Inventia, in different laboratories under different protocols. The 2 profiles were separated by 0.24 standard deviations of patient variation, against a monoculture to tri-culture displacement of 3.4 standard deviations.
The proximity metric was specified before any result was examined: all biomodules with no feature selection, each standardized within its own cohort, Euclidean distance to the condition centroid, and the nearest 10% of patients. The analysis was repeated at 5% and 20%, and with Manhattan and cosine distance. The direction of the shift was preserved in all 9 combinations, spanning 1.05 to 1.76 patient standard deviations.
The inflammatory program requires all three cell types
The shift toward patient immune biology implies that an inflammatory state is being generated in culture which mimics what is seen in patients. In patient tumors, the CXCR3 chemokines CXCL9, CXCL10 and CXCL11 are what recruit CD8 T cells and mark the tumors that respond to checkpoint blockade7, 8. We hypothesized that this inflammatory program may be in part responsible for the biology observed in the T-cell containing cultures. Indeed, these chemokines rose together with the immune regulatory genes and the inflammatory cytokines, and only when all 3 cell types were present (Figure 2). Monoculture and the fibroblast co-culture expressed none of them above the detection floor. The T-cell co-culture expressed a trace of several. The tri-culture expressed all 9 at a high level.
CXCL9 spans the widest range. It was undetected in monoculture and in the fibroblast co-culture, reached 1.1 transcripts per million in the T-cell co-culture, and reached 915 in tri-culture, with every replicate above 650. IDO1 and CXCL10 follow the same pattern, at 215 and 456 transcripts per million in tri-culture against 0.7 and 5.8 in the T-cell co-culture.
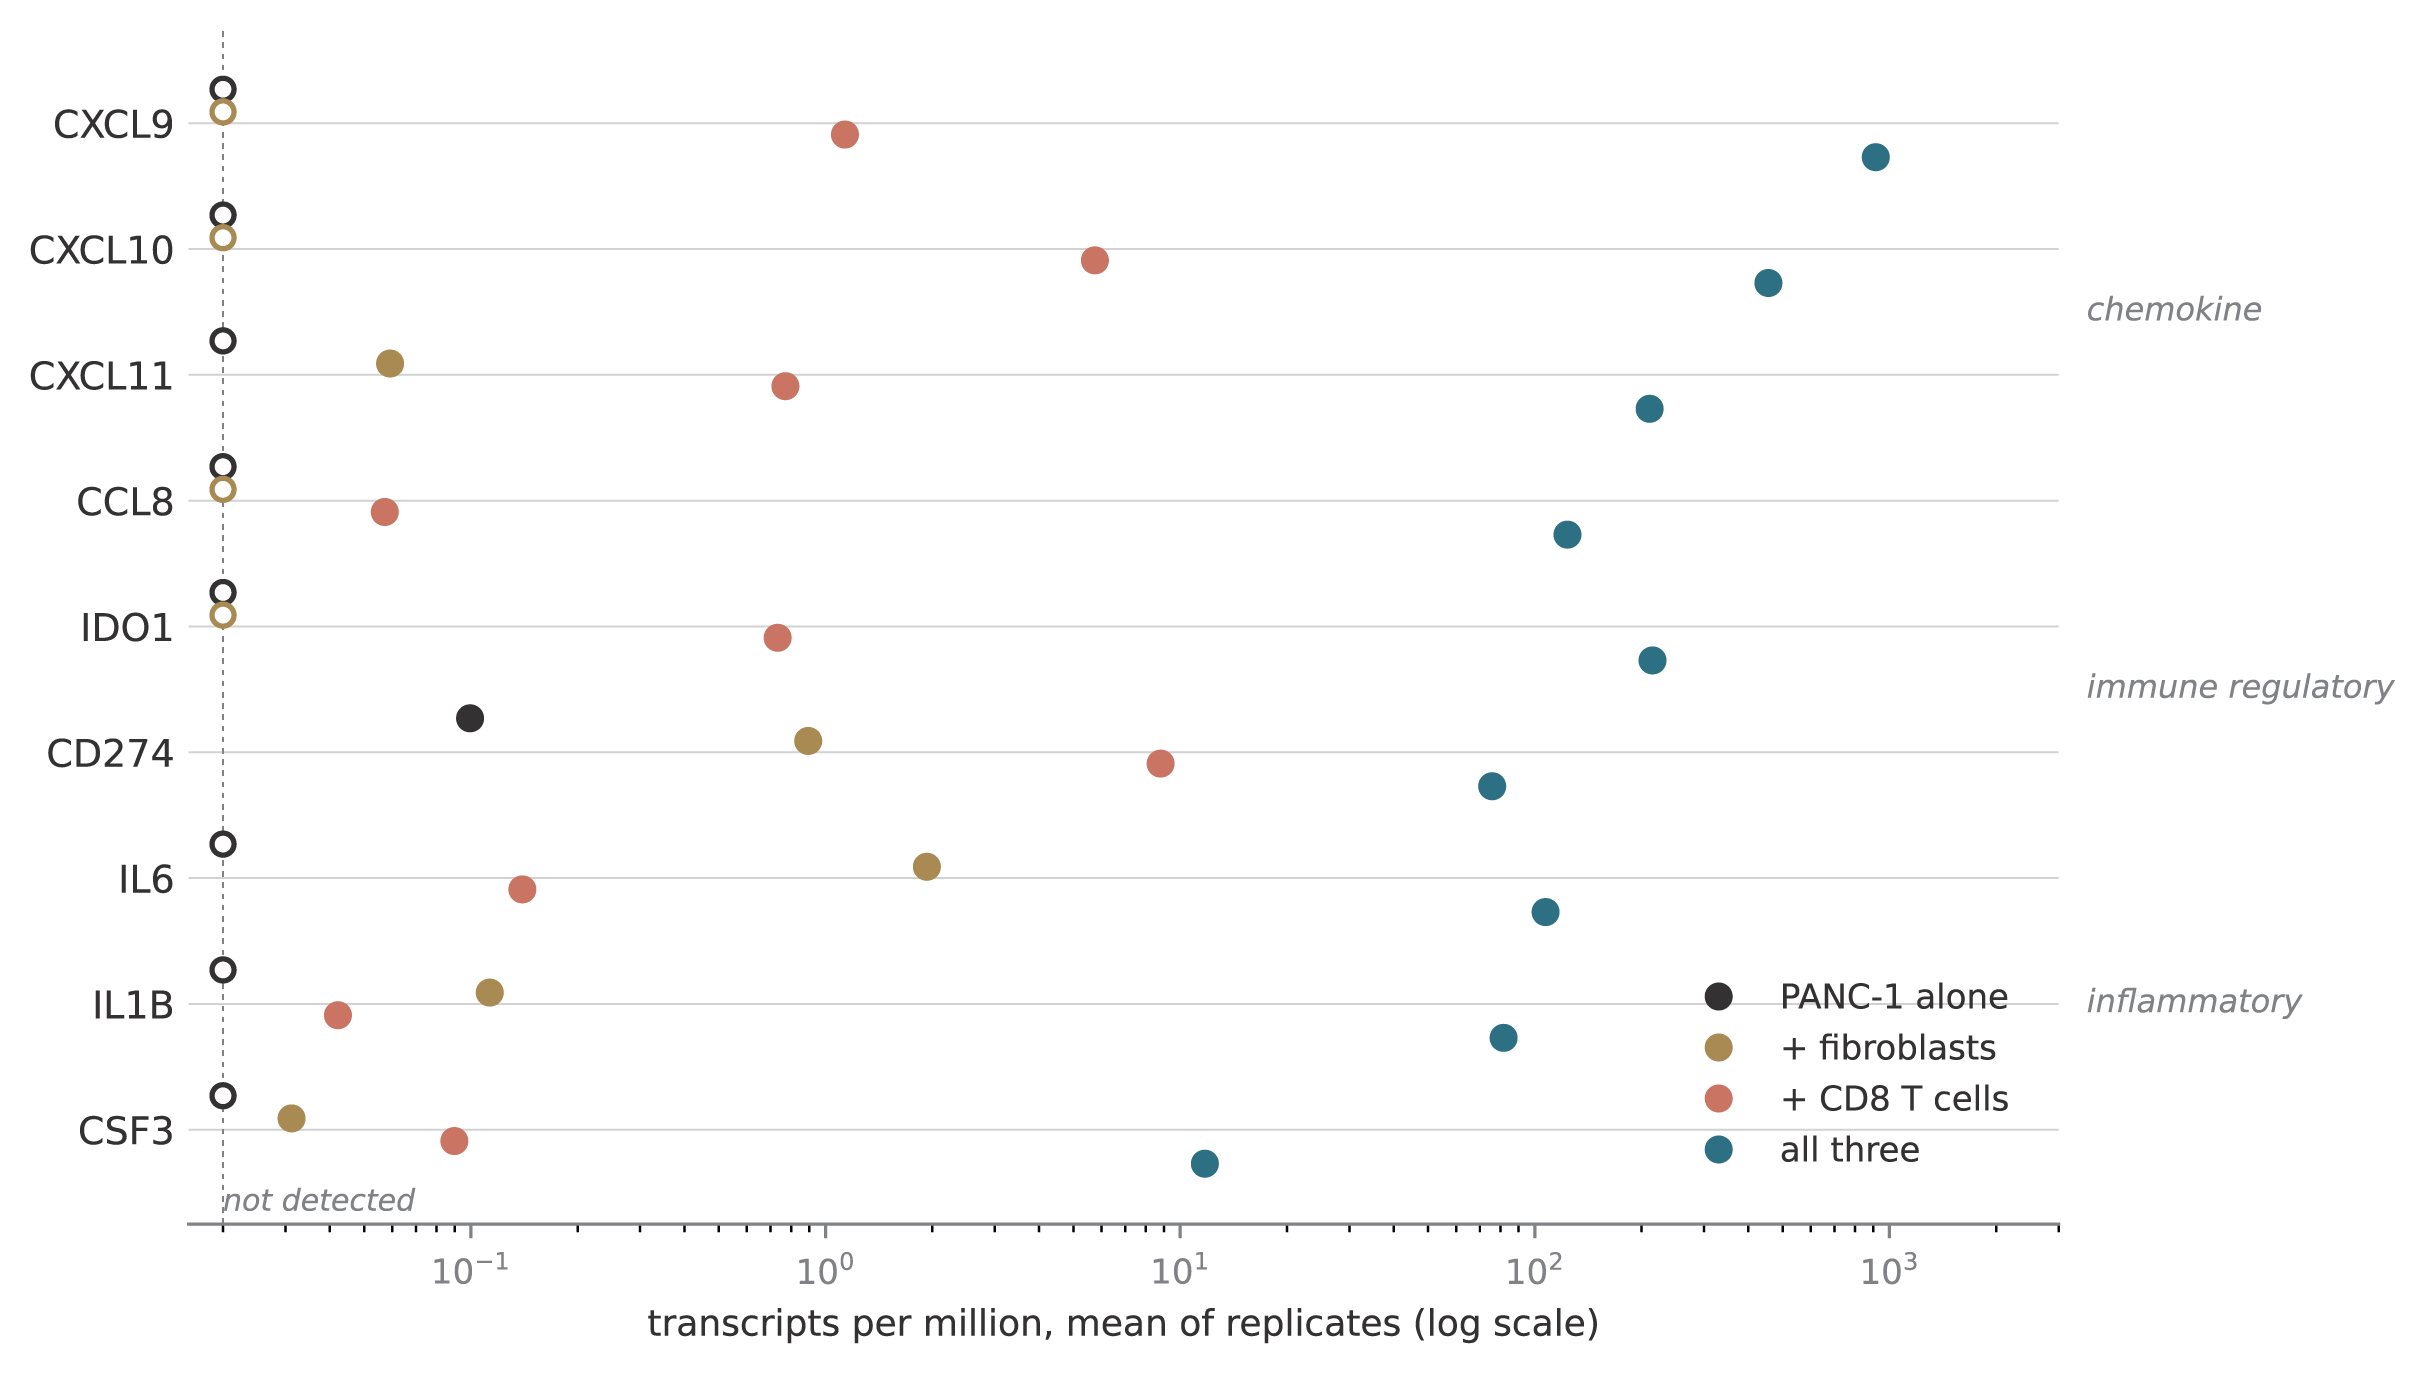
Figure 2. Inflammatory and chemokine transcripts across the four PANC-1 conditions. Each point is the mean of replicates for one condition, 3 for the arms containing T cells and 2 for monoculture and the fibroblast co-culture. Open circles mark genes below 0.02 transcripts per million, the detection floor used here. Values are given in the text for CXCL9, CXCL10 and IDO1. Inventia data are evaluation-only.
A tri-culture holds 3 cell types, so it contributes 3 sources of RNA where the other arms contribute 1 or 2. Some of the extra signal has to be the sum of those parts. The question is whether the inflammatory program is more than that sum.
We computed the sum directly. For each tri-culture replicate we predicted what it should look like from the 3 simpler cultures, then measured how far the real sample ran above that prediction. 94 genes ran above it in every replicate and under all 10 variants of the fit, at a false discovery rate below 0.01. CXCL9 ran 436 fold above.
So the tri-culture makes far more inflammatory signal than its 3 cell types make apart. The combination does something the parts do not.
Two things support that conclusion. The prediction was built from genes that identify the cell types, so the inflammatory genes being tested took no part in setting their own expectation. And the implied make-up of the tri-culture, 18 to 27% tumor RNA, 7 to 13% fibroblast and 58 to 63% T cell, matched separate marker-gene estimates of 29%, 5% and 63%.
The result also holds without knowing the cell proportions. Each culture we measured is itself a fixed combination of the same 3 cell types, so fitting on the measured cultures is equivalent to fitting on pure populations, whatever those proportions are. Run in its strictest form the fit still leaves 251 genes.
These results support an inflammatory program that depends on crosstalk between the cancer cells, fibroblasts and T cells, beyond what their combined RNA accounts for. This led us to test which cell type supplies the initiating signal and which produces the chemokines, by comparing the T-cell co-culture with the tri-culture, the 2 arms that differ only by the fibroblasts.
Interferon supply and the cellular source of the chemokine response
The 2 arms containing T cells differ only by the fibroblasts, so we hypothesized that the difference between them would be a readout of the crosstalk between T cells and stroma: the T cells deliver interferon, the fibroblasts change state in response, and the altered fibroblasts produce the inflammatory output.
To test this we first examined the T-cell component. Interferon gamma drives CXCR3 chemokine expression in tumors, and per unit of T-cell RNA it was unchanged between the 2 arms, 0.282 against 0.283, holding at 0.86 to 1.04 fold across 5 other T-cell anchors (Figure 3A).
By contrast to the T cells, the fibroblasts shifted transcriptional state. Among genes only fibroblasts express in this system, COL1A1, COL3A1 and CD248 fell 2.64, 2.72 and 1.80 log2 below the mixture prediction while SERPINB2, SERPING1, A2M, MMP3 and PDGFRA rose. These findings suggest the fibroblast leaves its structural, collagen-producing state and takes on the secretory inflammatory CAF phenotype described in pancreatic cancer9.
The chemokine output follows that switch. CXCL9 rose 900 to 1,000 fold between the 2 arms on the same T-cell anchors, and among fibroblast-dependent genes 25 of 29 tracked fibroblast load against a background of 19.7% (p = 2.4e-14). Attributing the output to the cancer cells would require their per-cell rates to rise 475 fold for CXCL9 and 1,374 fold for IL1B. Figure 3B shows the genes running above the mixture prediction together with the matrix genes running below it.
We hypothesized that IL1B may trigger the switch, since IL1 is a characterized inducer of the inflammatory CAF state in PDAC through LIF and JAK/STAT10. IL1B was undetected in monoculture, 0.1 transcripts per million with fibroblasts and 0.04 with T cells, and reached 82 in tri-culture. This led us to ask whether the same dependencies hold in patient tumors.
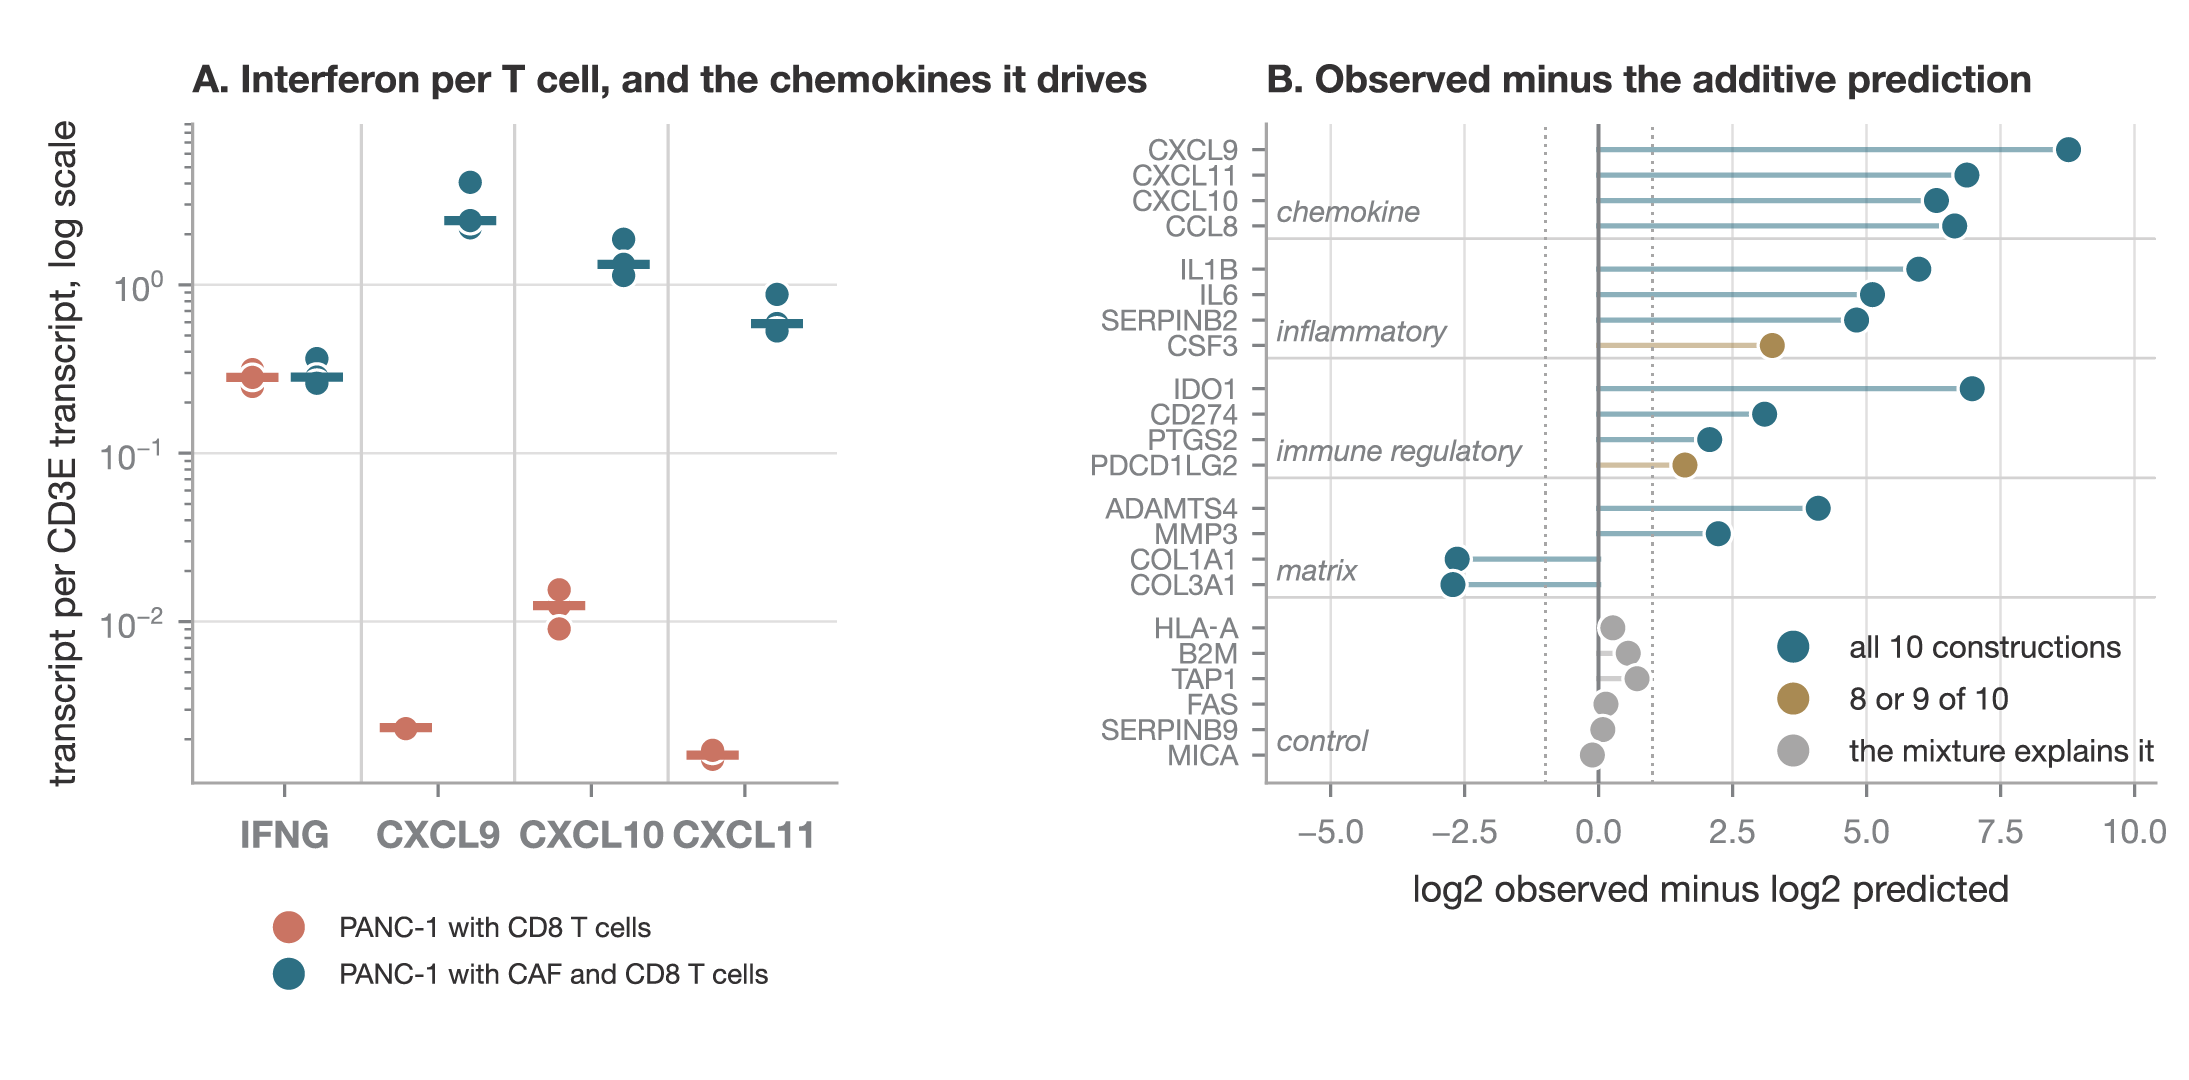
Figure 3. Interferon output per T cell, and the genes that exceed an additive mixture. A, interferon gamma and 3 CXCR3 ligands in the T-cell arm and in the tri-culture, each divided by CD3E in the same library so the comparison is per unit of T-cell RNA. Points are individual libraries and the bar is the mean. B, how far each gene runs above or below the level predicted by combining the 3 simpler cultures. Points to the right of zero are higher than predicted, points to the left lower. Color shows how many of the 10 variants of the fit agreed. Inventia data are evaluation-only.
Tri-cultures phenocopy patient tumors
The culture therefore places the fibroblast at the center of the chemokine response. To test that in patients we built 2 fibroblast signatures out of the culture itself: the genes that rose in the tri-culture fibroblasts, and the collagen genes that fell. Scoring patient tumors on both asks whether the same dependency holds there, and whether the patient groups nearest each culture condition shift accordingly (Figure 4).
Across all 3 cohorts, holding interferon gamma, myeloid content and the 2 fibroblast signatures constant for one another, CXCR3 ligand expression tracked interferon gamma most strongly, then the activated fibroblast signature. Patient tumors therefore carry a similar biology to the culture. The chemokines tracked fibroblast state and not fibroblast abundance, just as they did in the dish: patients with abundant collagen-rich stroma scored low on the chemokine axis, and those whose fibroblasts sat in the secretory state scored high.
Partial Spearman correlations with the CXCR3 chemokines, each predictor controlled for the others, in cohort 3, TCGA PAAD and CPTAC PDAC respectively: interferon gamma +0.49, +0.58 and +0.50; the activated fibroblast signature +0.12, +0.23 and +0.28; the structural fibroblast score −0.06, −0.14 and −0.35.
The patients nearest the tri-culture carry more immune cells by the collection’s own independent counts: total immune content rose from 6.7% to 19.9% against a cohort median of 14.7%, macrophages from 2.1% to 7.5%, and CD8 T cells from 0.0% to 1.18% (p = 0.018), while pathologist-assessed tumor percentage fell from 60 to 40. Because those counts played no part in selecting the groups, they confirm that the tri-culture sits among genuinely immune-infiltrated tumors.
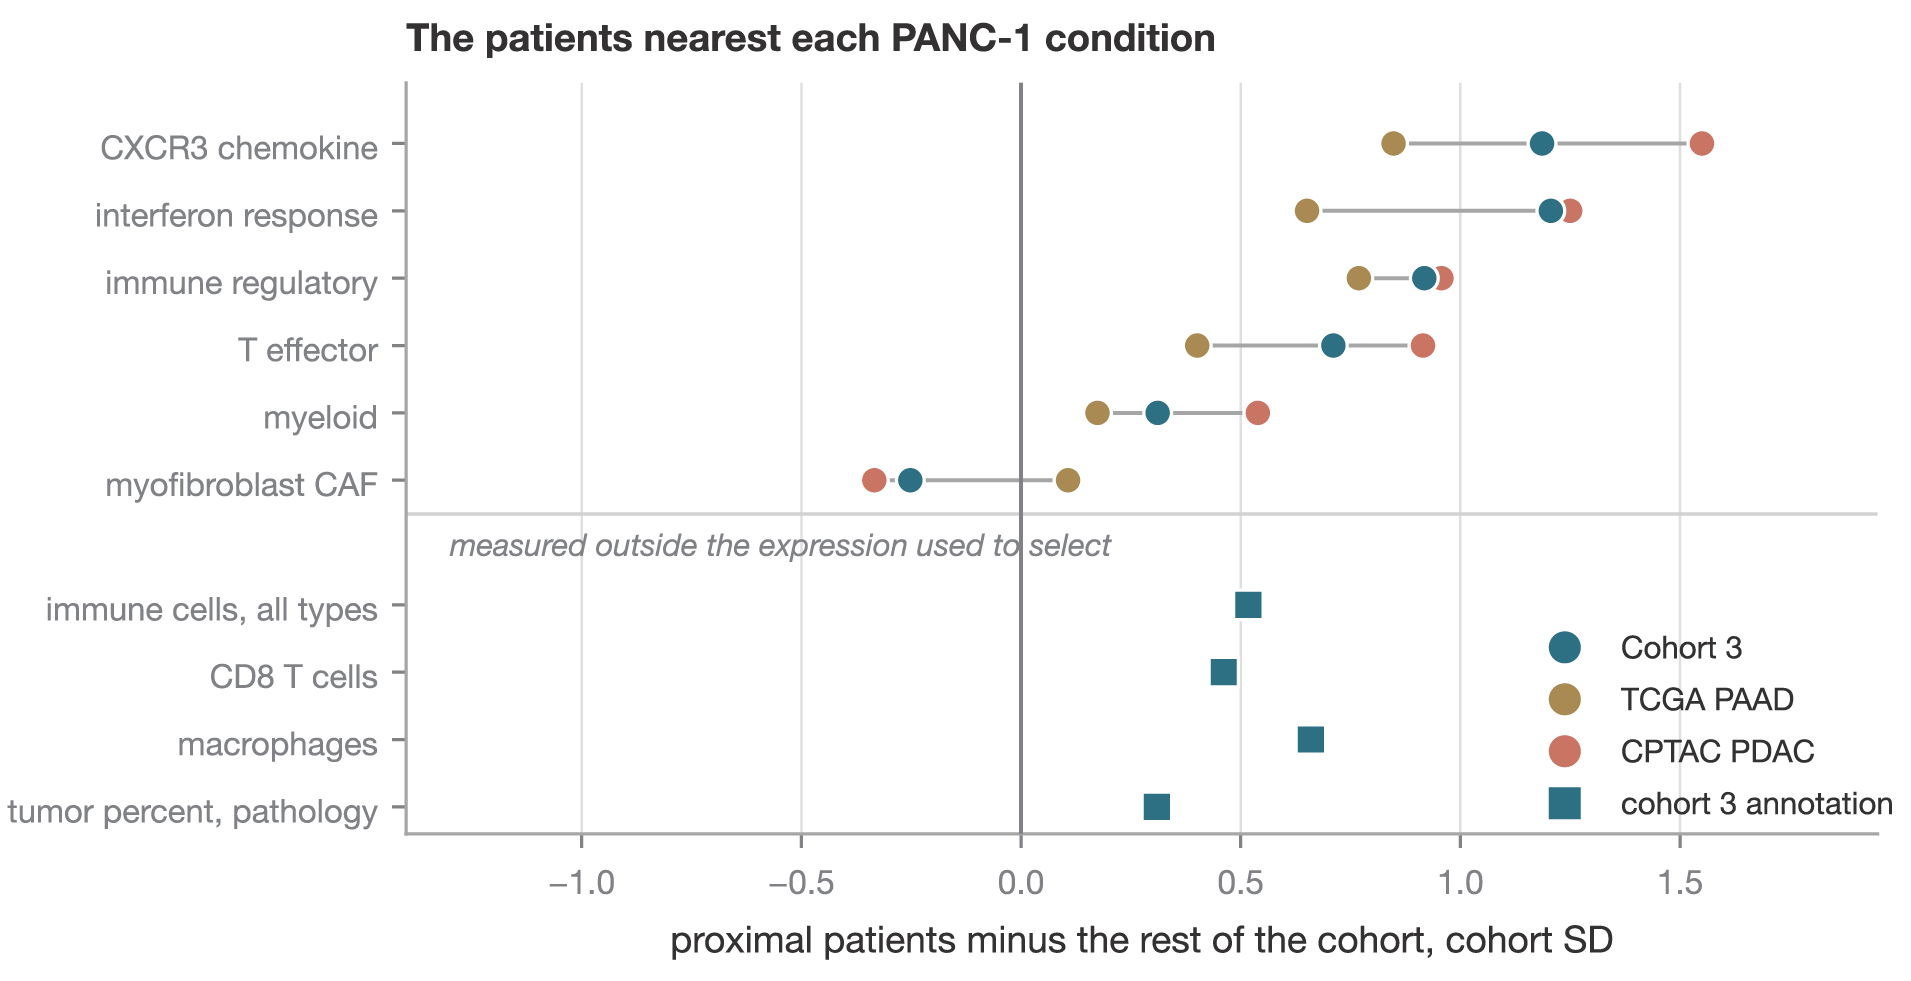
Figure 4. The patients nearest each PANC-1 condition. Proximal patients are the nearest 10% of each cohort to the PANC-1 centroid for that condition, under a metric fixed in advance across all 150 biomodules. Values are the proximal group minus the rest of that cohort, in cohort standard deviations, for the tri-culture. The upper rows are derived from the same expression the metric uses and therefore describe the selection. The lower rows come from the clinically annotated collection’s own immune deconvolution and pathology report, which are measured independently of that expression. Cohort 3 derived results are internal pending that cohort’s review. Inventia data are evaluation-only.
Conclusions
The central finding is a change of fibroblast state. Cancer cells, fibroblasts and CD8 T cells together drove pancreatic fibroblasts out of their collagen-producing program and into a secretory, inflammatory one, and that state phenocopies what patient tumors show. The chemokine output and the dependencies behind it appear in patient biology across all 3 cohorts, and the tri-culture sits among the patients who carry them.
Three cell types are sufficient to initiate that program under the conditions tested. Patients appear to reach a similar state with more of the microenvironment in play: myeloid content tracked the chemokine axis independently across the cohorts, and macrophage-derived CXCL9 and CXCL10 are required for the antitumor response to checkpoint blockade in vivo7. The culture arrives at the same inflammatory contexture by a shorter route, which is the sense in which it phenocopies the patient state.
That difference is itself informative. The patient reference names the compartment the model lacks and attaches a number to it, which makes myeloid cells or related biological programs the next addition worth testing.
Together, Inventia and Genialis connect controllable experimental biology with patient-referenced molecular insight. RASTRUM enables systematic investigation of how defined changes to the tumour microenvironment influence cancer biology, while the Genialis Supermodel identifies which aspects of patient tumour biology these models capture. This provides a framework for refining preclinical models and investigating the biological mechanisms most relevant to a particular therapeutic question.
Selected references
- Orlandi E, et al. State of the Art of Immune Checkpoint Inhibitors in Unresectable Pancreatic Cancer: A Comprehensive Systematic Review. Int J Mol Sci. 2025;26:2620. doi:10.3390/ijms26062620.
- Inventia Life Science. RASTRUM 3D Cell Culture Platform. https://inventialifescience.com/platform.
- Genialis. Genialis Supermodel. https://www.genialis.com/supermodel/.
- Cancer Genome Atlas Research Network. Integrated genomic characterization of pancreatic ductal adenocarcinoma. Cancer Cell. 2017;32:185–203.e13. doi:10.1016/j.ccell.2017.07.007.
- Cao L, et al. Proteogenomic characterization of pancreatic ductal adenocarcinoma. Cell. 2021;184:5031–5052.e26. doi:10.1016/j.cell.2021.08.023.
- Ghandi M, et al. Next-generation characterization of the Cancer Cell Line Encyclopedia. Nature. 2019;569:503–508. doi:10.1038/s41586-019-1186-3.
- House IG, Savas P, Lai J, et al. Macrophage-derived CXCL9 and CXCL10 are required for antitumor immune responses following immune checkpoint blockade. Clin Cancer Res. 2020;26:487–504. doi:10.1158/1078-0432.CCR-19-1868.
- Harlin H, Meng Y, Peterson AC, et al. Chemokine expression in melanoma metastases associated with CD8+ T-cell recruitment. Cancer Res. 2009;69:3077–3085. doi:10.1158/0008-5472.CAN-08-2281.
- Öhlund D, Handly-Santana A, Biffi G, et al. Distinct populations of inflammatory fibroblasts and myofibroblasts in pancreatic cancer. J Exp Med. 2017;214:579–596. doi:10.1084/jem.20162024.
- Biffi G, Oni TE, Spielman B, et al. IL1-induced JAK/STAT signaling is antagonized by TGFβ to shape CAF heterogeneity in pancreatic ductal adenocarcinoma. Cancer Discov. 2019;9:282–301. doi:10.1158/2159-8290.CD-18-0710.